The UNB Strike, by the Numbers - UNB Operating Grant
I know people on all sides of the UNB strike debate personally, and I respect them all a great deal. But until things got to a point where the professors at UNB were going on strike, I wasn’t really paying attention to the debate all that much. When I started to dig into the numbers that were publicly available, I found them lacking context and clarity. So, I’ve decided to do them myself.
This first post is about the UNB Operating grant, or the ‘chequing account’ as I’ve heard it referred to. Basically, the fund of money that UNB can use at its disposal to pay for things like salaries, benefits, library costs, maintenance and other such things. It’s largely made up of two large components - provincial government funding and tuition/fees - and a small bit of other revenue.
I’ve heard it said that the government funding portion of this account has gone up and down for the past few years, and this is true in a sense, but not unless you’re familiar with the difference between ‘real’ and ‘nominal’ dollars. In nominal dollars - that is, the actual number you’d see in a financial report each year - it has gone up consistently, after being stuck on a gentle slope for a while:
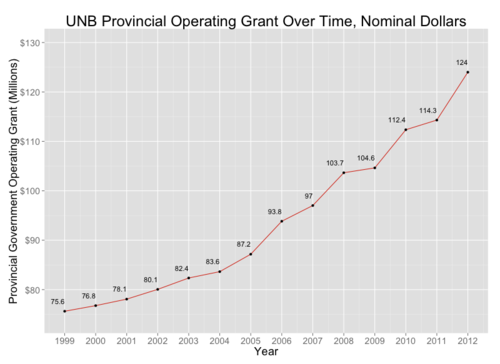
(Source: CAUBO: Financial Information of Universities and Colleges. Note: the 2012 figure is an estimate from a graph provided by the UNB Comptroller in their 2012-2013 report, as these numbers are not available publicly through CAUBO yet. If anybody has access to better information for the past few years, let me know. )
In ‘real’ terms, however, things look a bit different. Real refers to the funding amount with inflation accounted for. Things generally cost more each year than the year before, and so putting them all in terms of a single reference year helps to compare different years. In 2002 dollars, the graph looks like this:
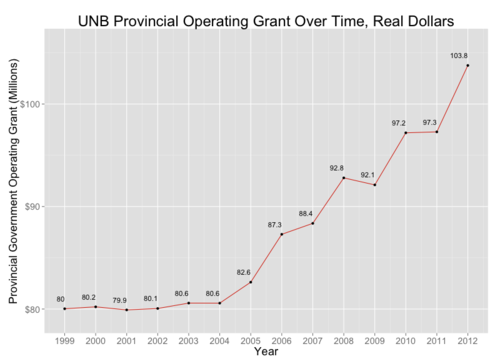
(Source: CAUBO: Financial Information of Universities and Colleges)
Here we see that from 1999-2004, the government actually didn’t increase the funding to UNB at all. Since then, it has gone up rapidly, with some years it going in reverse in real dollars. So, even though the government gave more ‘nominal’ dollars to UNB in 2009 than it did in 2008, what the university could purchase with those dollars decreased. That being said, UNB has much more funding today than it did in 2004 to the tune of 28.8%.
Looking at the growth rates of this fund, in nominal terms, it looks like it has grown steadily:
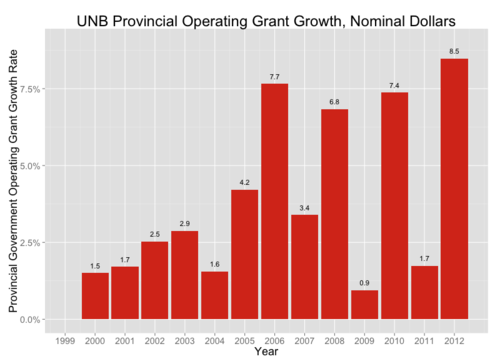
(Source: CAUBO: Financial Information of Universities and Colleges)
While in real terms, though the growth has been good, there has been some back-sliding:
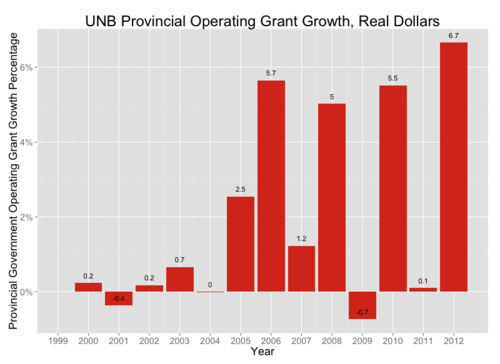
(Source: CAUBO: Financial Information of Universities and Colleges)
How do these amounts compare to the amount funded by UNB tuition and ancillary fees? The following, also from CAUBO’s figures, shows the trends for what portion of the total operating budget are covered by tuition and what portion are covered by government funding (if the numbers don’t add up to 100%, it’s because there is another small bit lumped under ‘other.’):
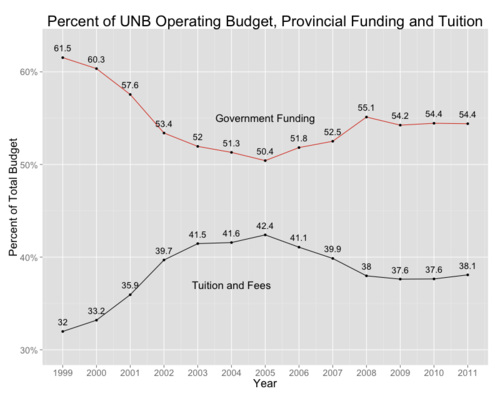
(Source: CAUBO: Financial Information of Universities and Colleges)
In the next post I’ll be taking a closer look at the salary figures that have been released and place them in context of other similar institutions.
Disclaimer: As mentioned above, I know members of both the UNB administration and faculty, and consider many to be friends. I am not being compensated monetarily or in any other way to produce this analysis by either side. All of the scripts I’ve used to create these are available for scrutiny on my GitHub page (for those that understand R, that is - sorry, the data was too complicated for Excel): https://github.com/Brideau/UNBStrikeWatch
Hey, I'm Ryan Brideau. I work as a Senior Data Scientist at Wealthsimple. Previously, I was at Shopify. You can follow me on Twitter here: @Brideau